
August 12, 2025
5 min read
Vishal Dixit
Top 3 Cryptocurrencies to Watch Ahead of the US Consumer Price Index Data
The cryptocurrency market is under pressure on Tuesday as Bitcoin (BTC) retraces to $118,500 at press time ahead of the US Consumer Price Index (CPI) data release at 12:30 GMT. The much-awaited data will likely provide further insights about the impact of US President Donald Trump's tariff hikes on the prices of consumer goods. Markets anticipate US inflation to rise to 2.8% in July, which could prompt the Fed to consider a widely expected 25-basis-point reduction in interest rates in September. Still, the short-term volatility surge could lead to heightened speculations. Amidst such volatility, the technical setups of Ethereum (ETH), Fartcoin, and Ethena (ENA) indicate a less volatile yet decisive trend ahead.Ethereum Could Uphold Bullish Sentiments
Ethereum maintains a bullish trend, trading above $4,300 at the time of writing on Tuesday. The Relative Strength Index (RSI) at 73 holds steady above the overbought zone, indicating heightened buying pressure. An uptick within the zone would signal extended gains. Adding credence to a bullish thesis, the Moving Average Convergence Divergence (MACD) line rises higher after crossing above its signal line on Saturday. The rising green bars indicate increasing bullish momentum. The uptrend in Ethereum targets the all-time high of $4,868, which would represent a 13% rise from the current market price.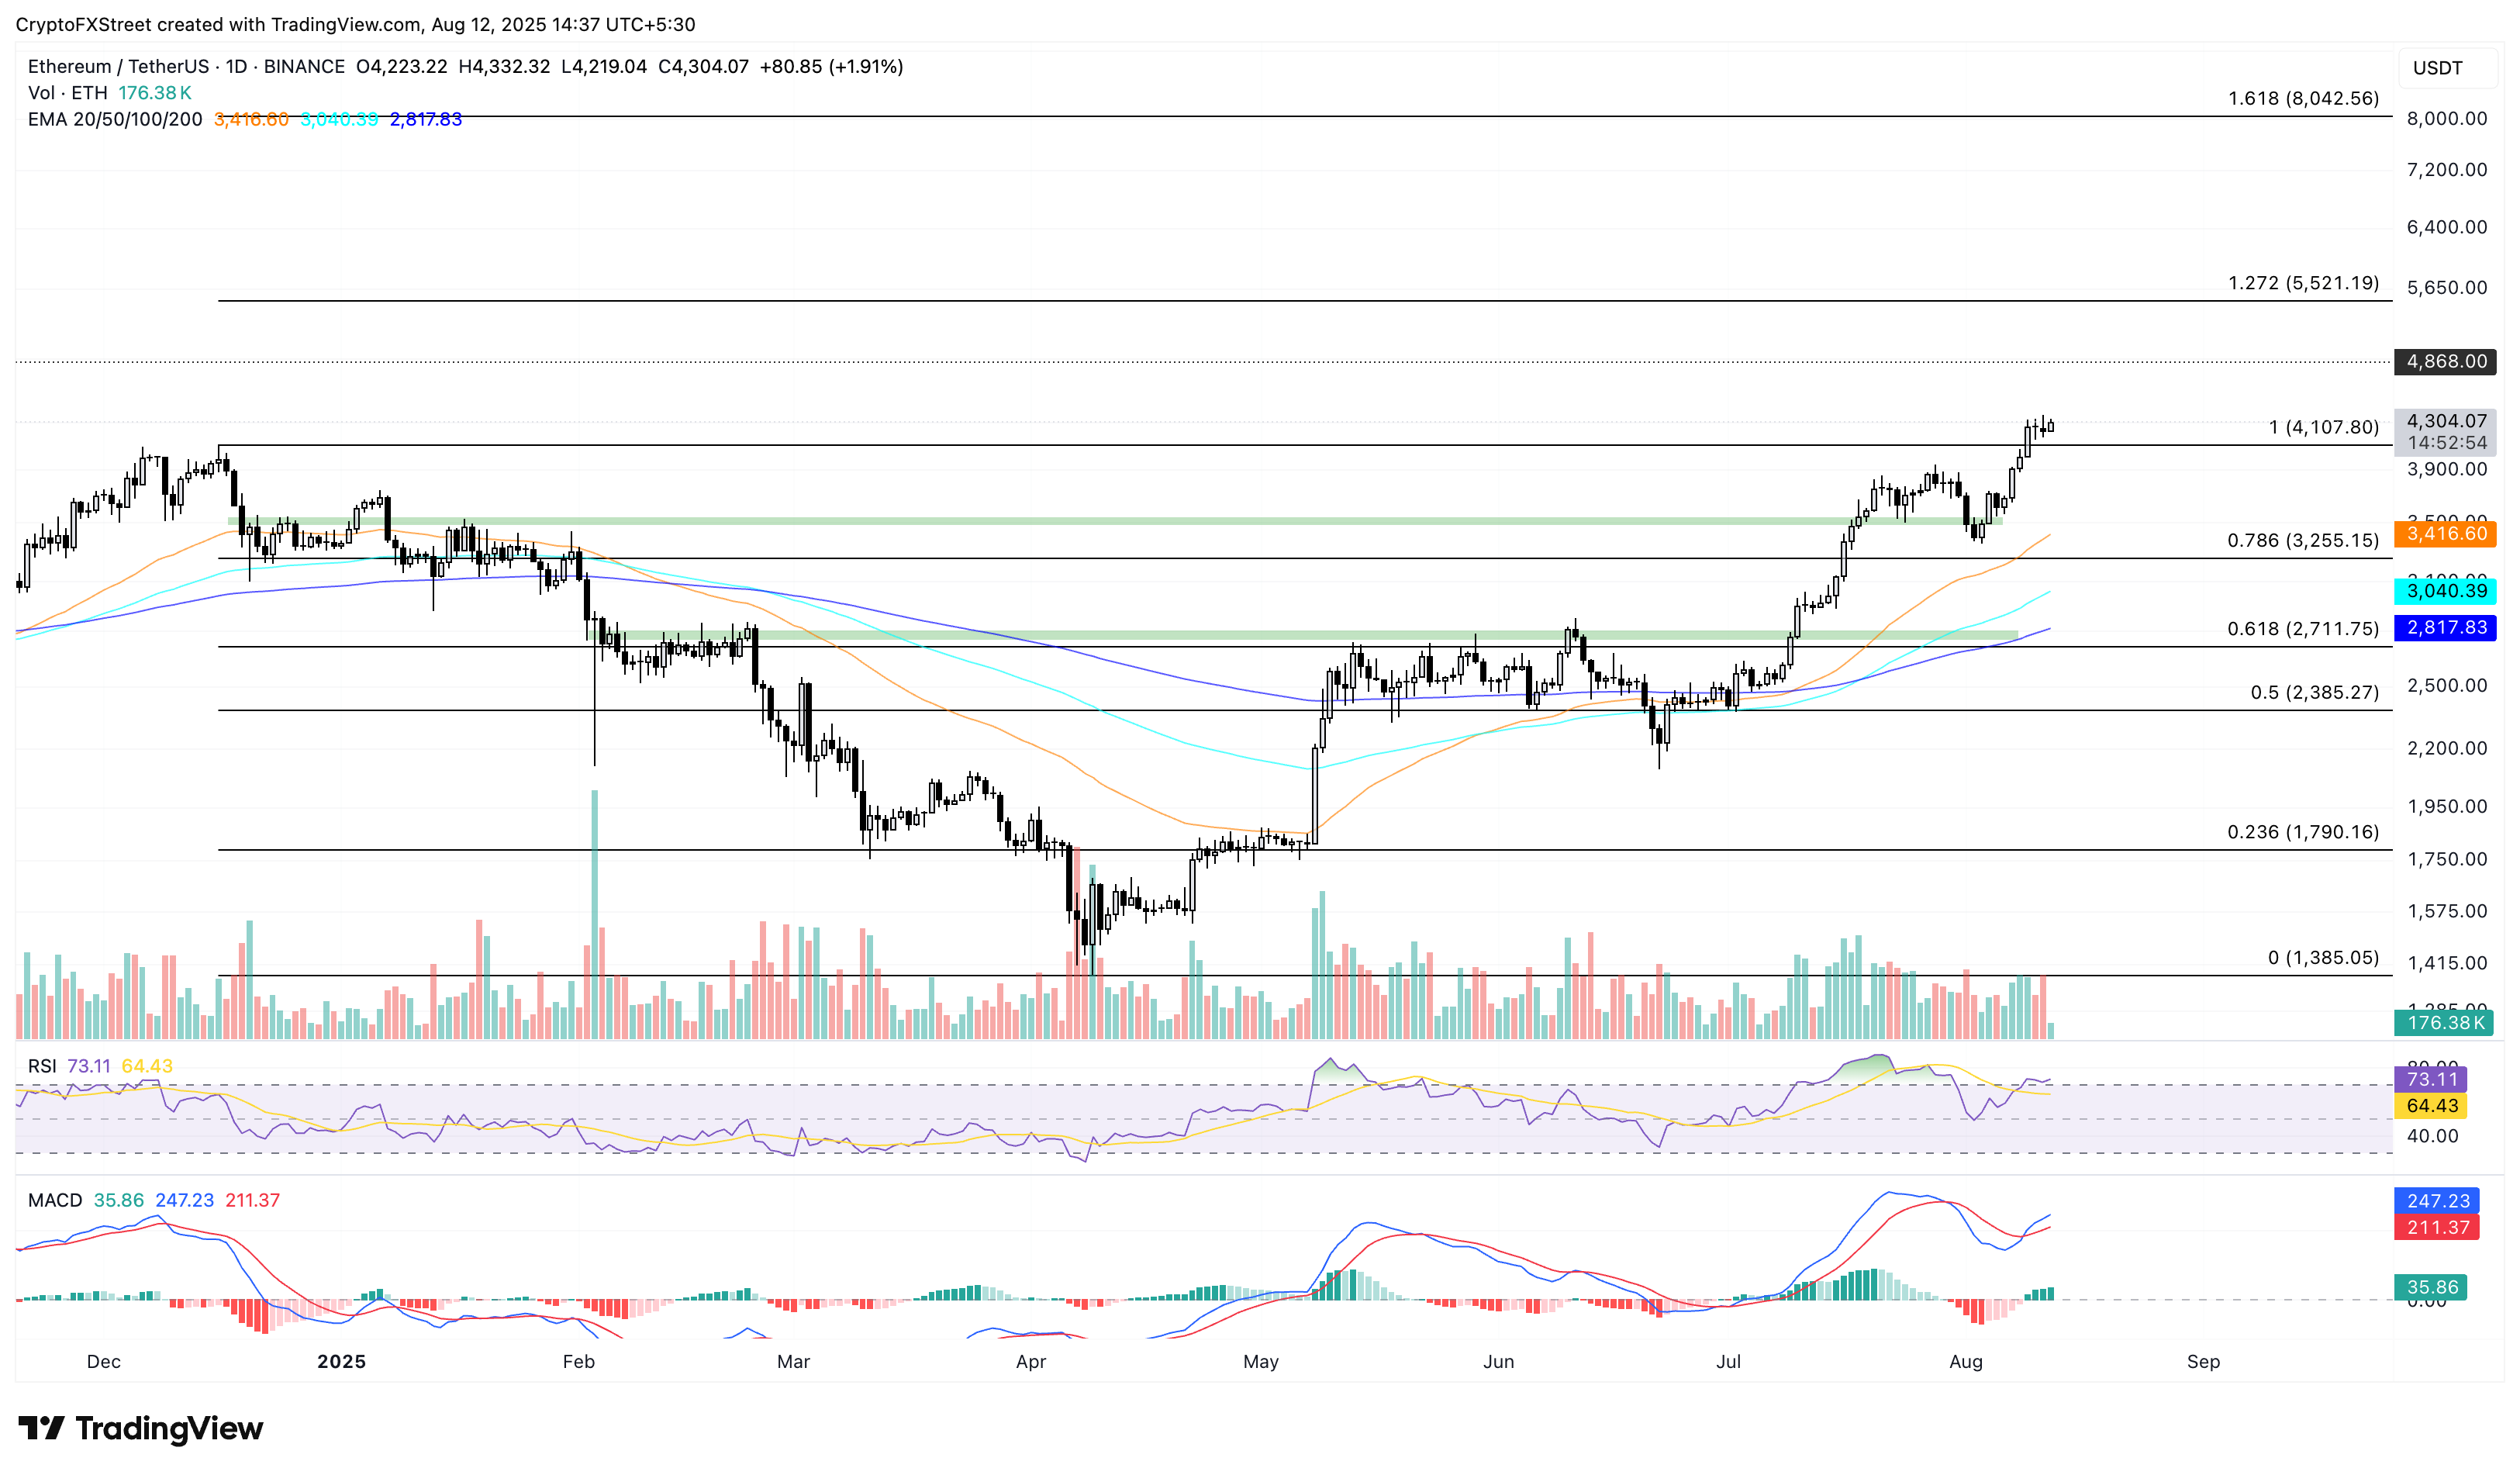 Looking down, a reversal below the $4,100 level would invalidate the bullish setup, risking a potential drop to the $4,000 psychological support. A decisive close below $4,000 would signal a sell opportunity for sidelined traders, targeting the 50-day Exponential Moving Average (EMA) at $3,416.
Fartcoin Risks Further Losses
Fartcoin takes a bearish turnaround with a daily close below the $0.8978 support on Monday, marking the lowest close since April 20. The meme coin depreciates by over 4% at the time of writing, extending the 18% loss from Monday. Fartcoin targets the 50% retracement level at $0.7378, drawn from the $2.7400 high on January 19 to the $0.1986 low on March 10. A decisive push below this level could test the $0.5730 level, last seen on April 8. The increasing selling pressure has lowered the RSI to 36, bringing it closer to the oversold zone. Furthermore, the MACD line crossed below its signal line on Monday, indicating renewed bearish momentum.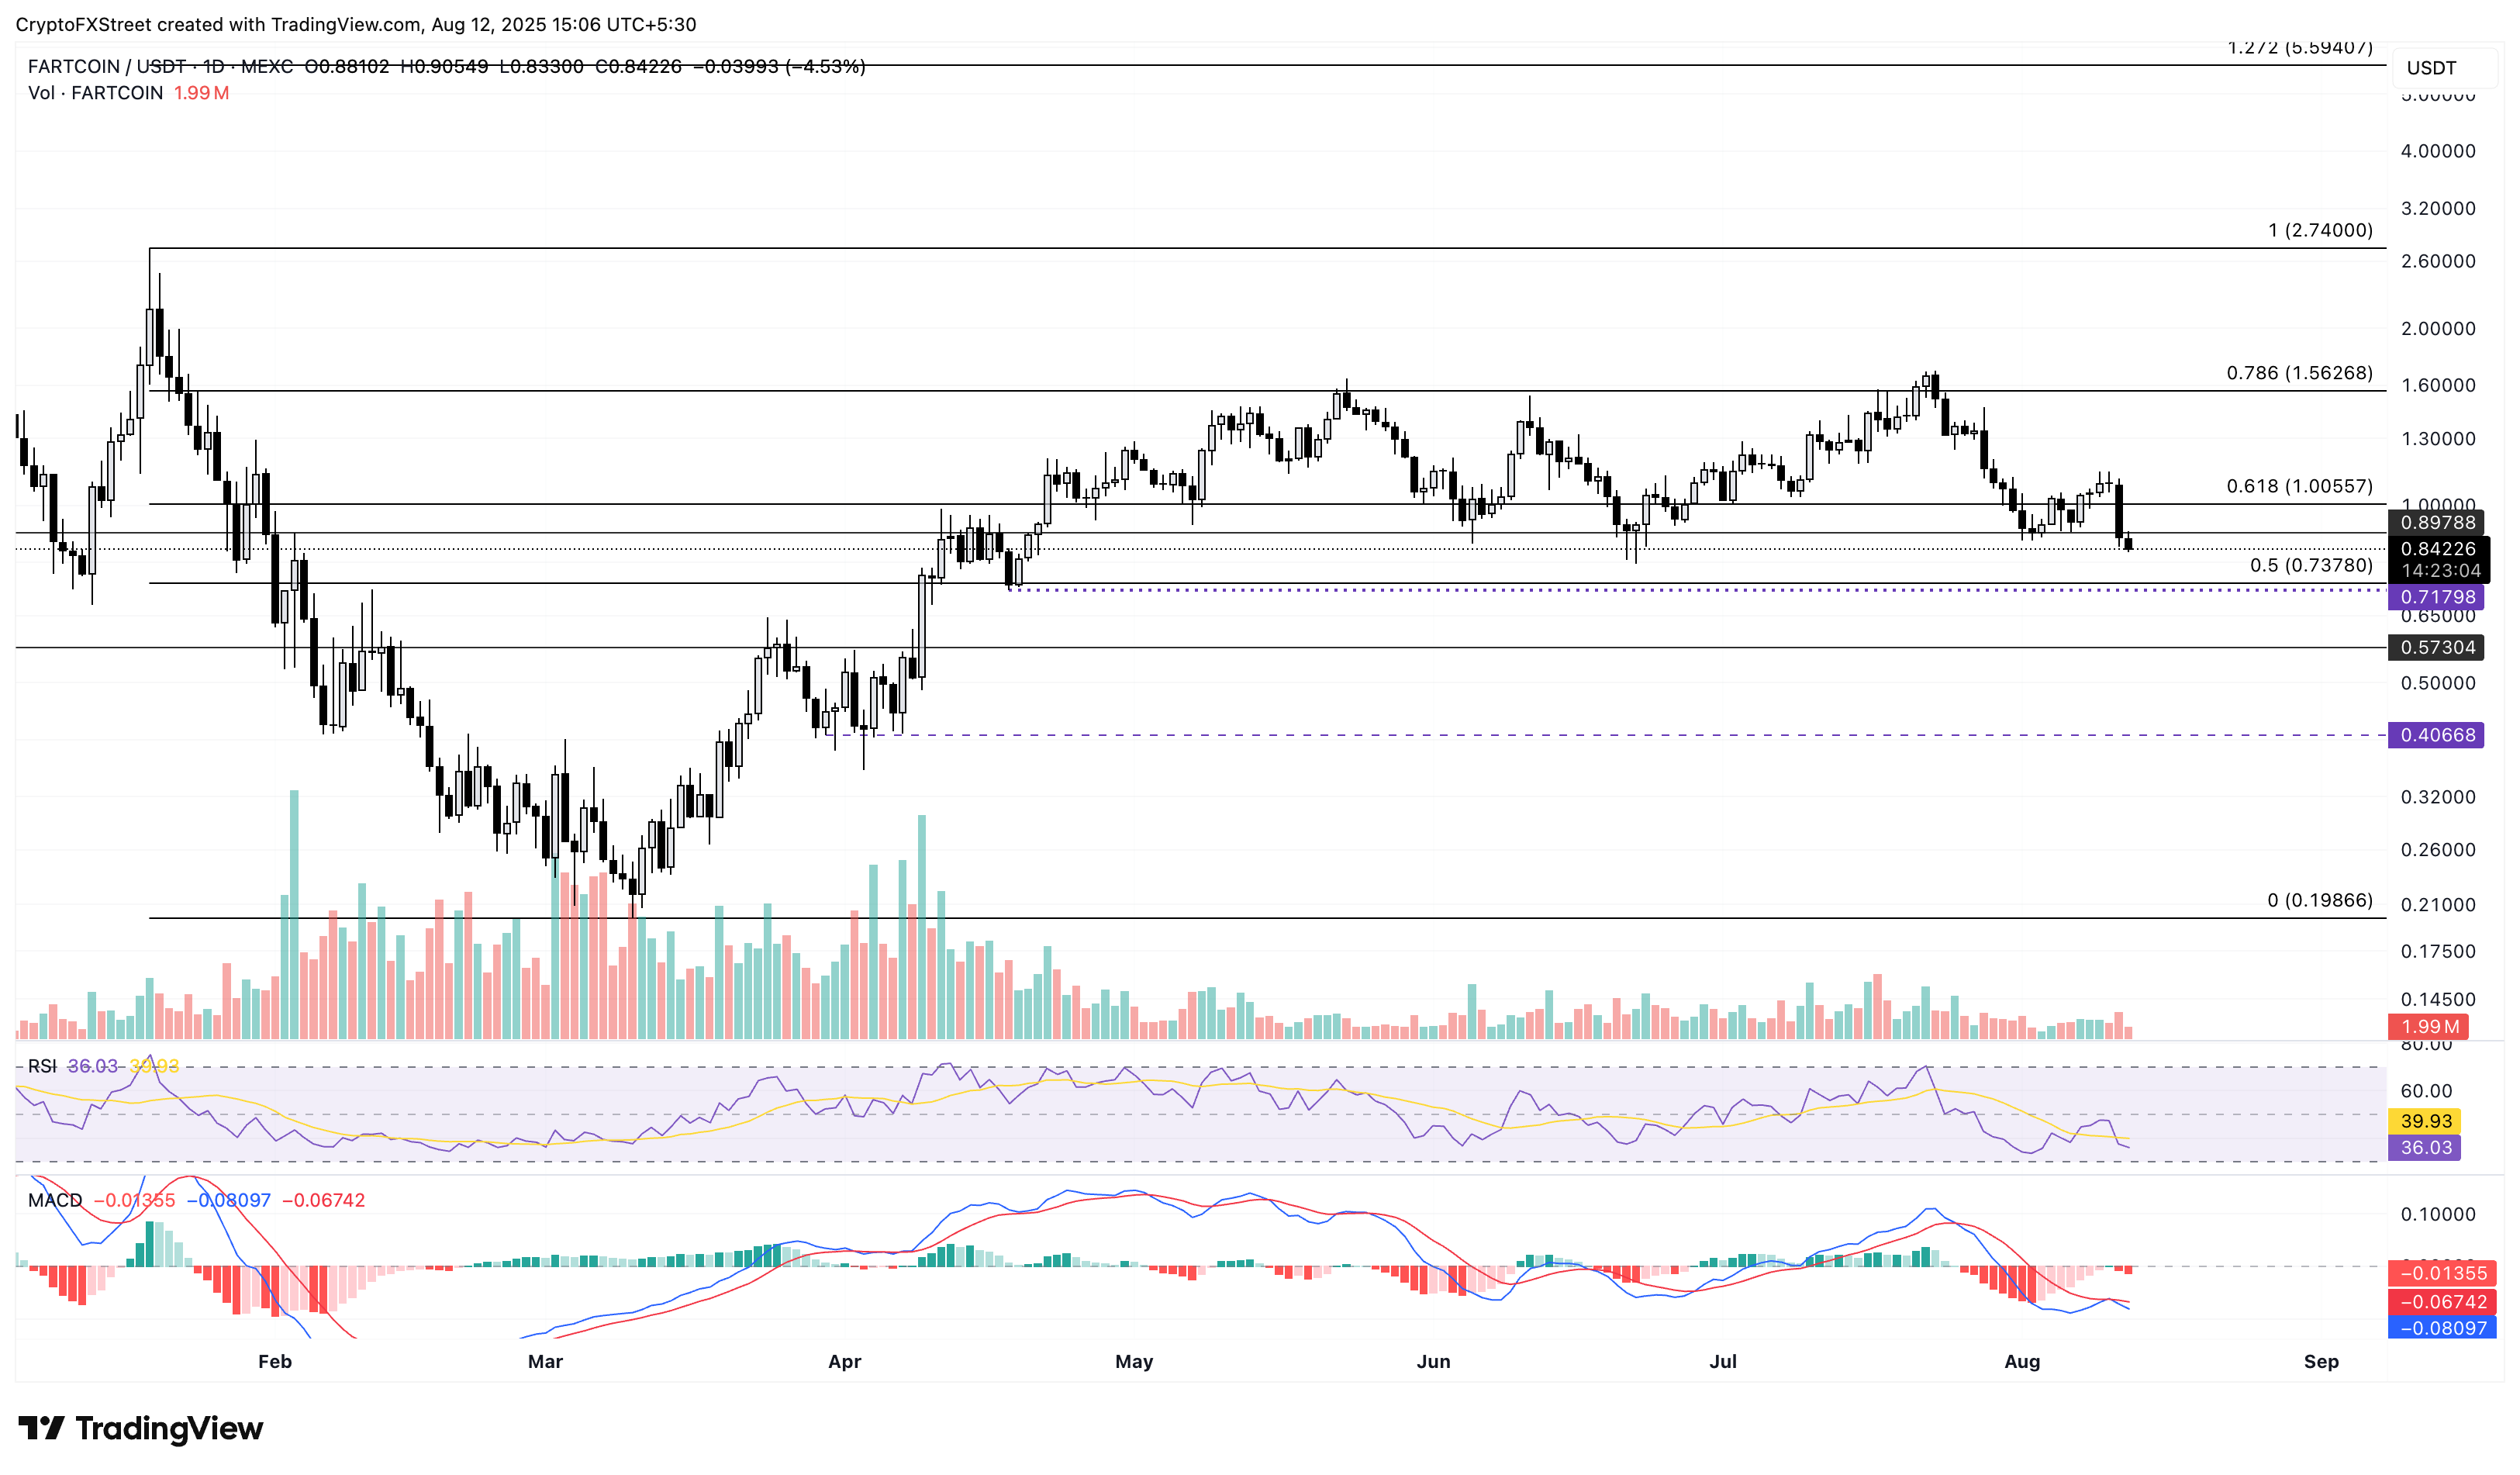 On the upside, investors should remain cautious until FARTCOIN overshadows the bearish engulfing candle formed on Monday with a close above $1.0859. This could extend the rally to the 78.6% Fibonacci level at $1.5626.
Ethena at Key Resistance Faces Overhead Pressure
Ethena struggles to surpass a key resistance at the $0.7982 level, forming a Doji candle on Monday. Typically, Doji candles foreshadow a trend reversal, in this case a decline, after a strong uptrend. At the time of writing, ENA edges lower by nearly 2%, hinting at a potential evening star pattern if the day ends in the red. Traders could consider the evening star formation as a sell signal, targeting the $0.6576 support level, marked by the January 28 close. The RSI at 71 edges lower towards the overbought boundary, hinting at exhausted buying pressure. Still, the MACD and its signal line maintain a positive alignment. Sidelined investors could consider a potential crossover in the average lines as a sign of trend reversal.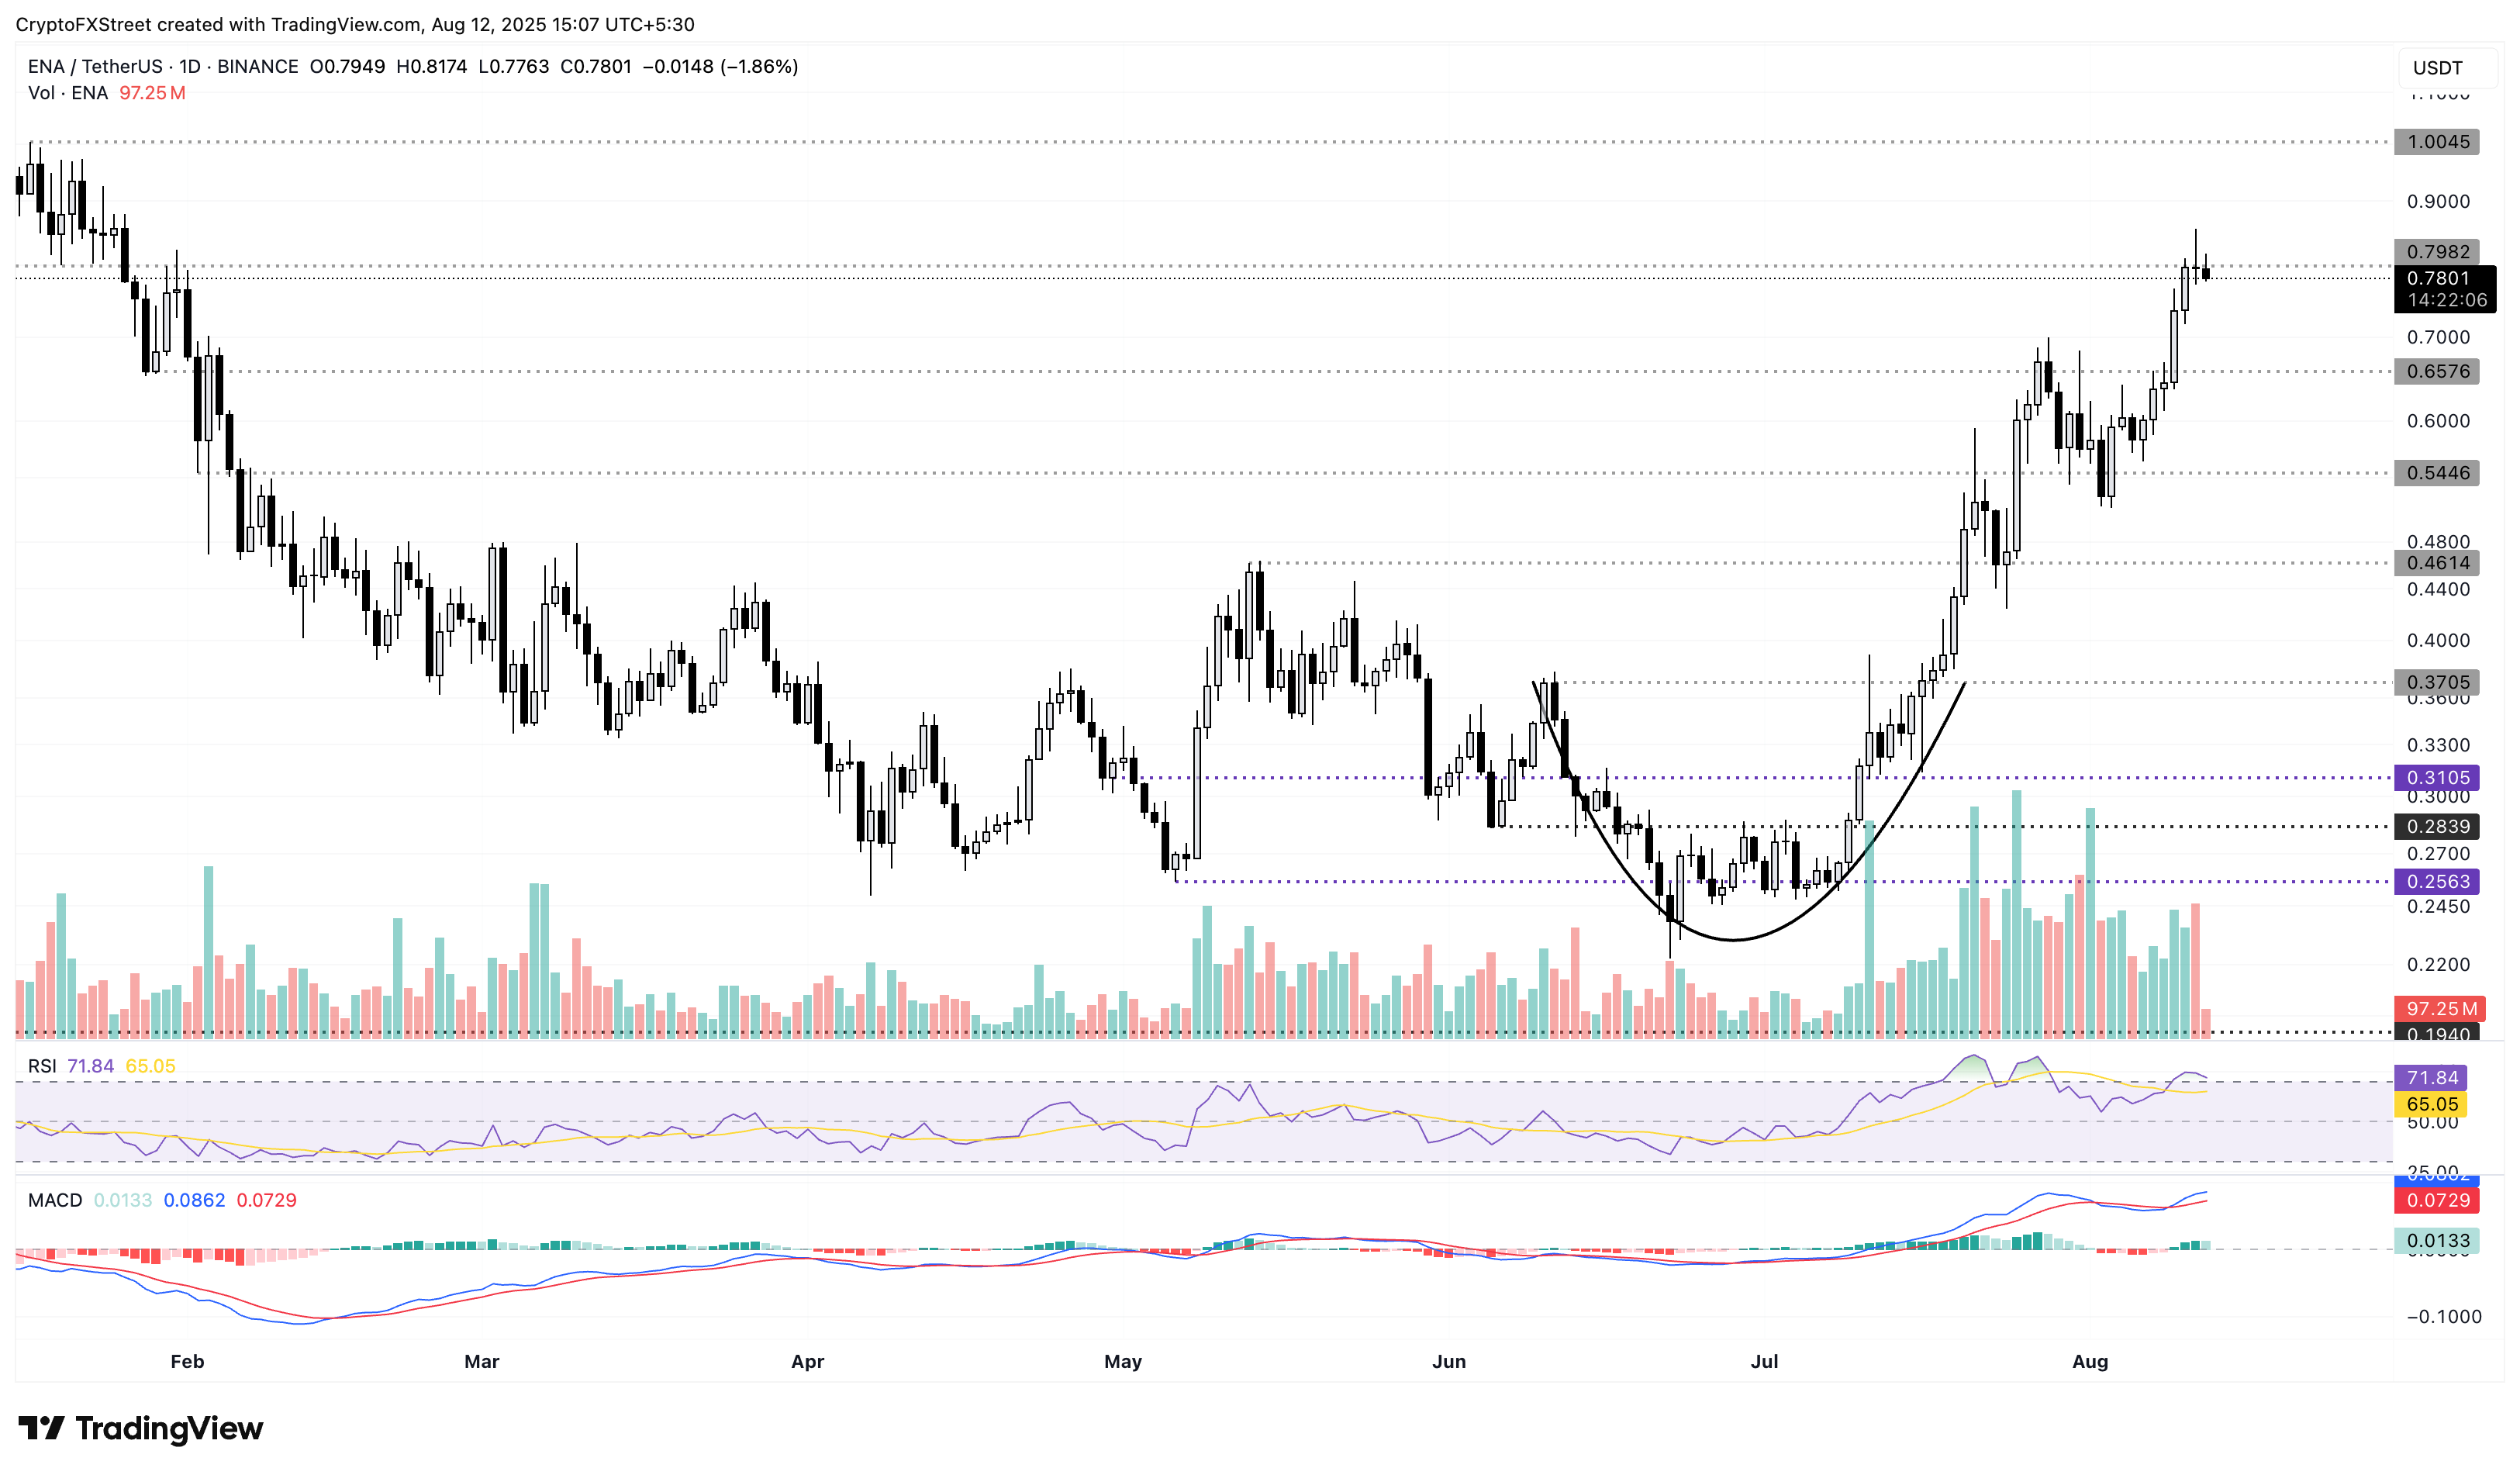 On the contrary, if Ethena prints a daily close above the $0.7892 level, the extended rally could target the $1.0000 psychological mark.
Information on these pages contains forward-looking statements that involve risks and uncertainties. Markets and instruments profiled on this page are for informational purposes only and should not be considered recommendations to buy or sell. Please do your own thorough research before making any investment decisions. Originally published at FXStreet on August 12, 2025.